S-plot2: Visualizing Genomic Comparisons
|
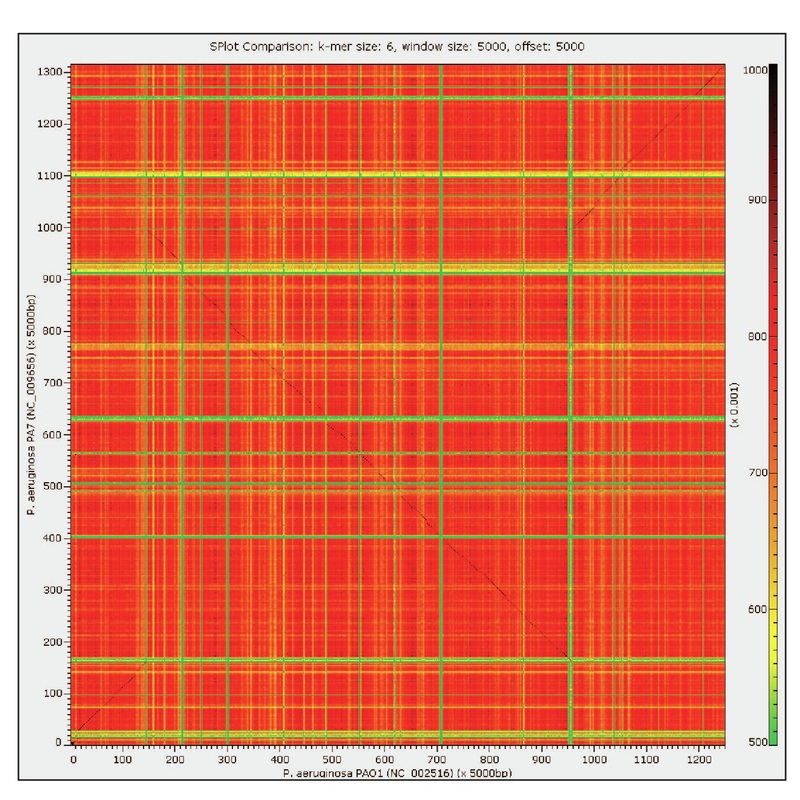
S-plot2 creates an interactive, two-dimensional heatmap capturing the similarities and dissimilarities in nucleotide usage between genomic sequences (partial or complete). You can compare bacterial genomes or even eukaryotic chromosomes in no time. Genome rearrangements as well as exogenous sequences acquired via horizontal gene transfer can thus be easily identified and further examined for their source(s). S-plot2 includes functionality to extract, generate statistics, and automate BLAST queries of regions of interest within the heatmap. This facilitates the investigation of quickly evolving coding regions, novel coding regions, and horizontally transferred elements. You can find S-plot2 online @ our Bitbucket site. Developed by L. Kalesinskas & E. Cudone |
|
Need help? Check out our tutorial.
|
| ||